Click on the weeks to read the investigation 🙂
Week 1
The site I chose is Victoria train station.
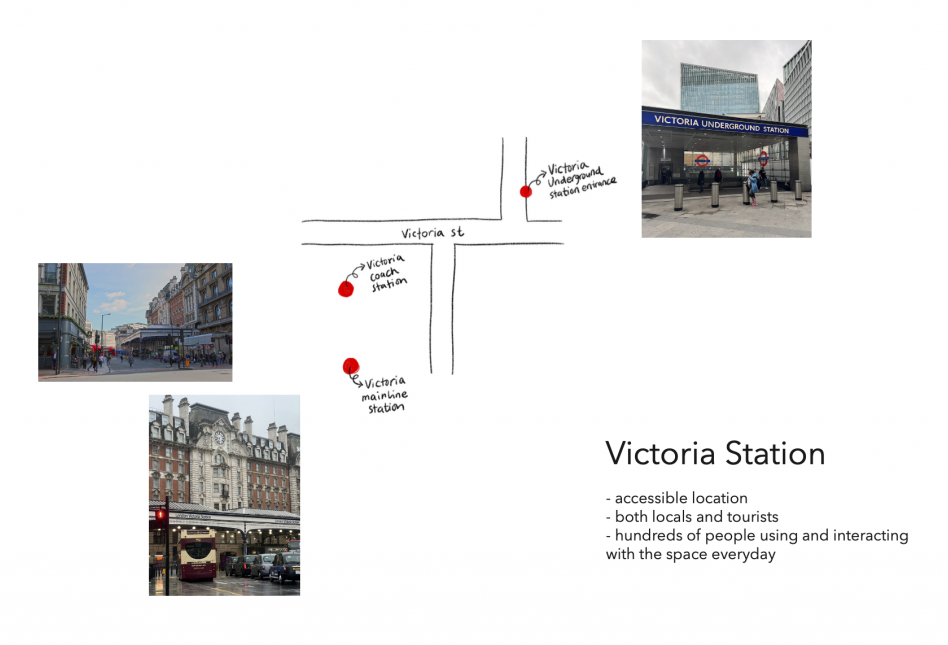
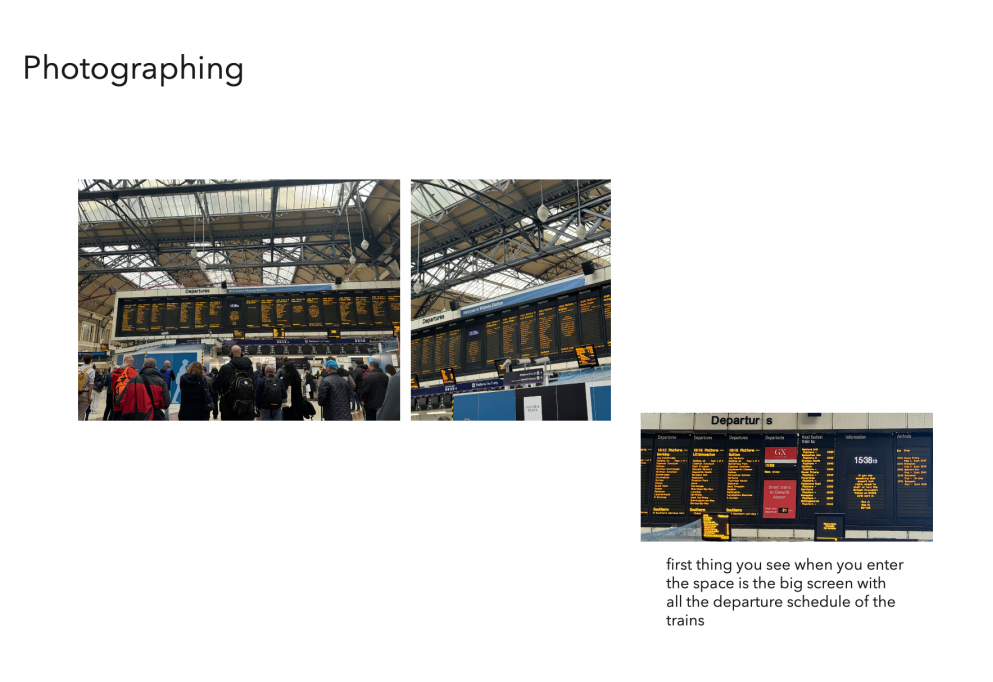
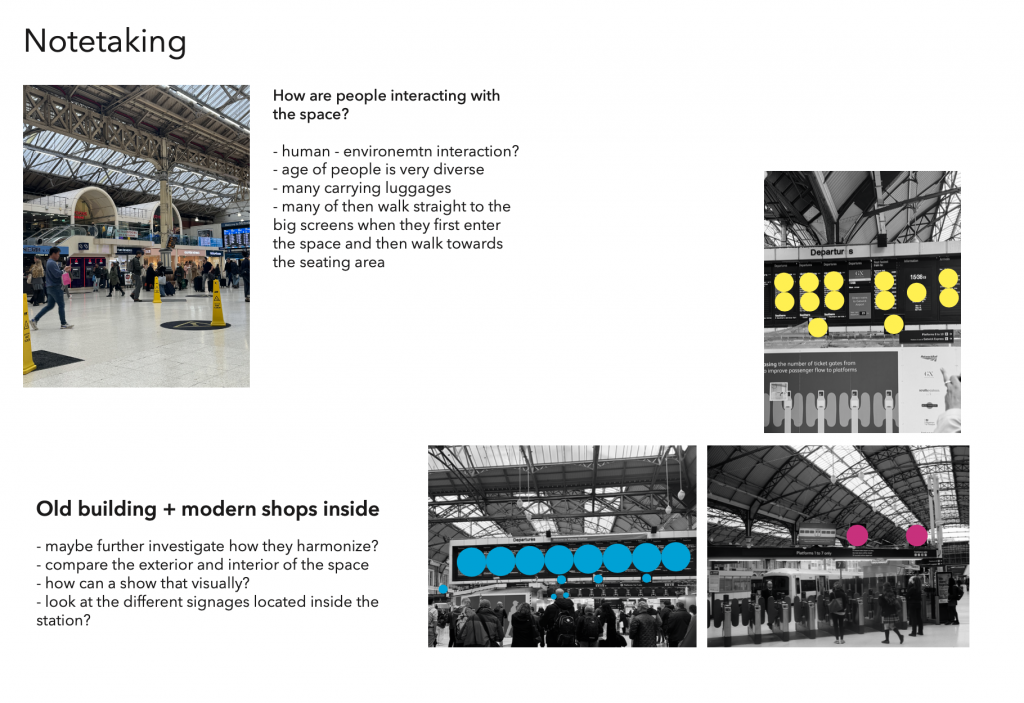
The initial investigation method was observation, which was recorded with photographs.
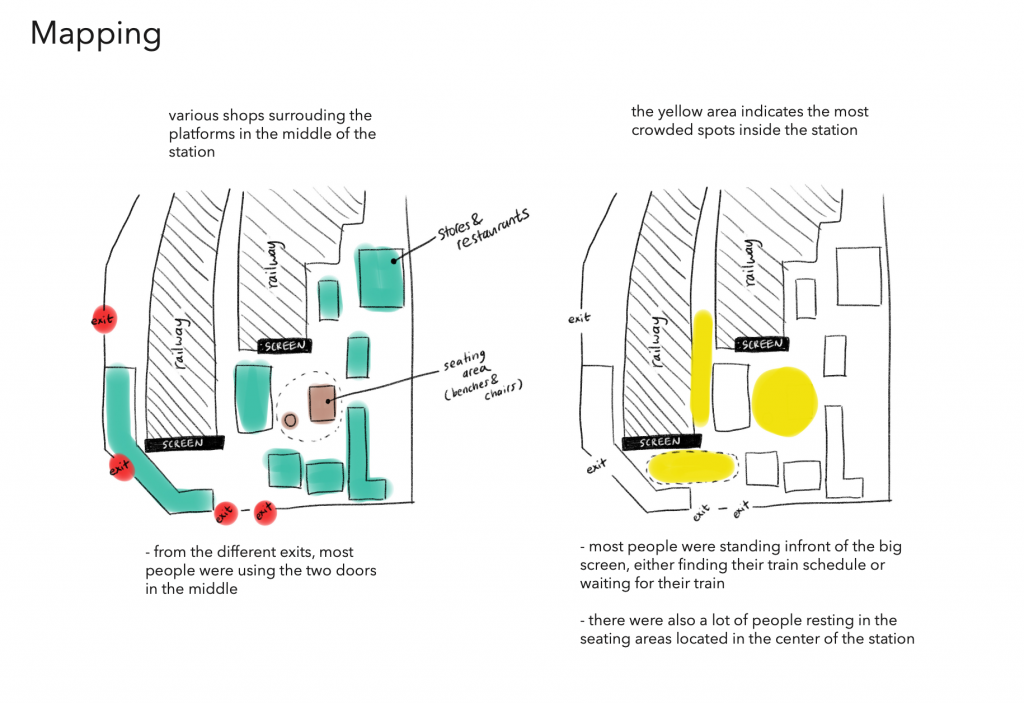
Feedback
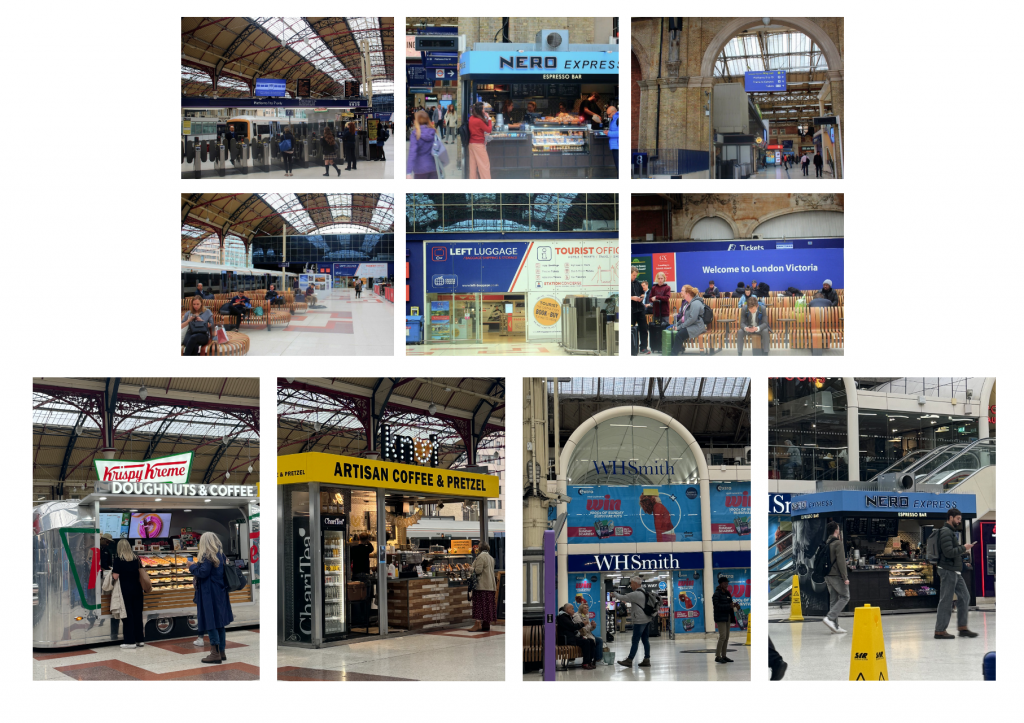
- Station is a hard place to investigate because it is a combination of so many different elements and different events happening simultaneously
- The site should be much more specific and small (for example: choose one window inside the station)
- The investigation needs to portray the small elements that can explain the whole environment >> what makes this site unique compared to other stations?
- Try to find different methods! Something New!
Week 2
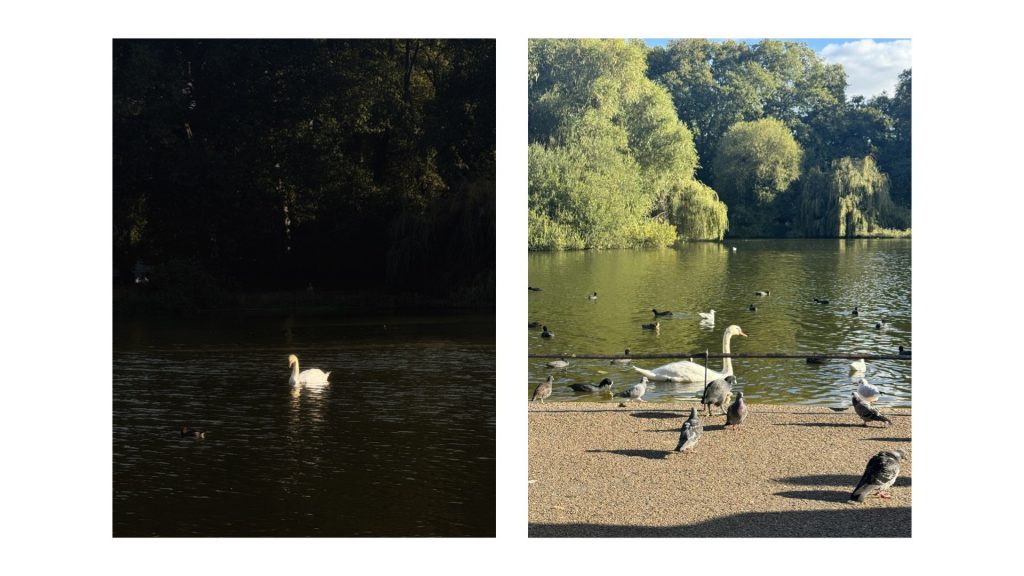
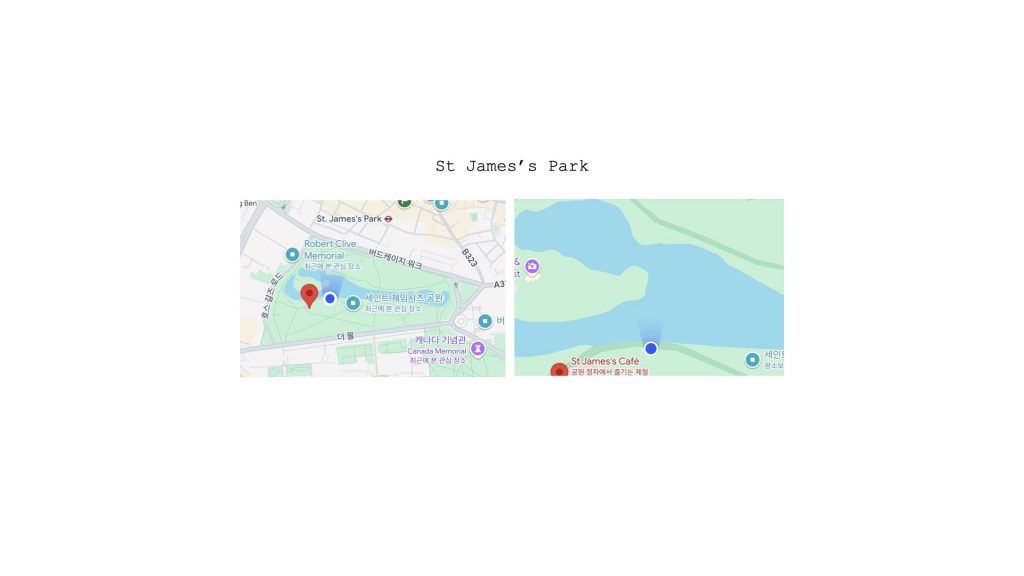
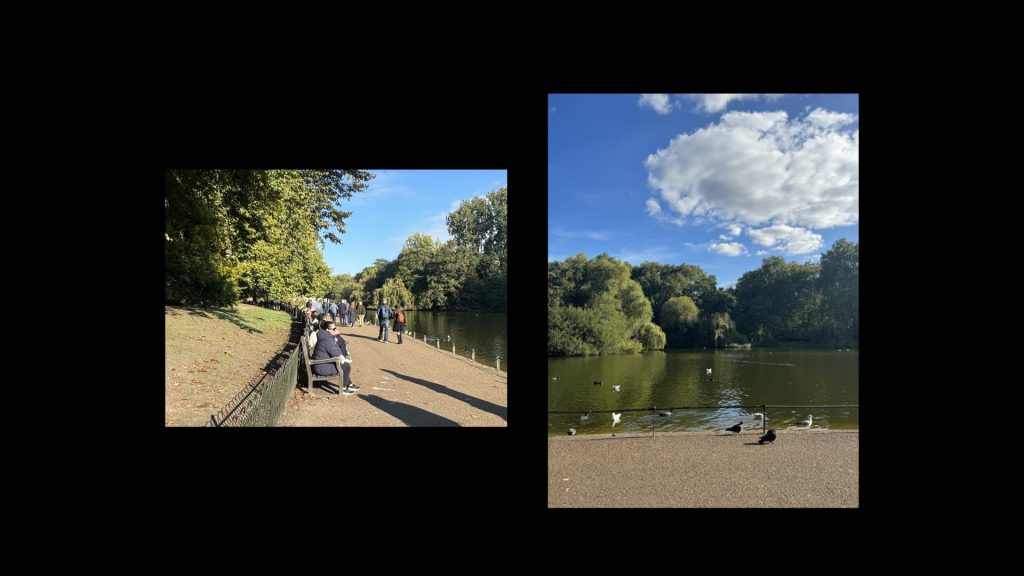
I change my investigation site to St. James’s Park. It’s only 15 minutes away from my place so I have visited the place multiple times. There is a specific area on the northern part of the park’s lake, where there are a series of benches where you could sit down facing the lake. The fences surrounding the lake are very low, so it’s easier to observe what is happening inside the river. I chose this spot for my new investigation site.
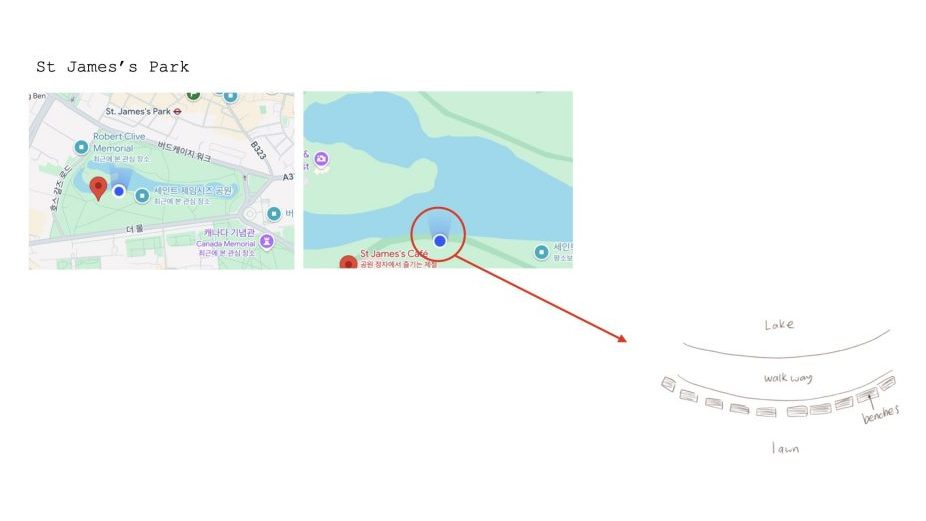
I took a sit on the bench in the middle and below is the view of the lake that I could observe.
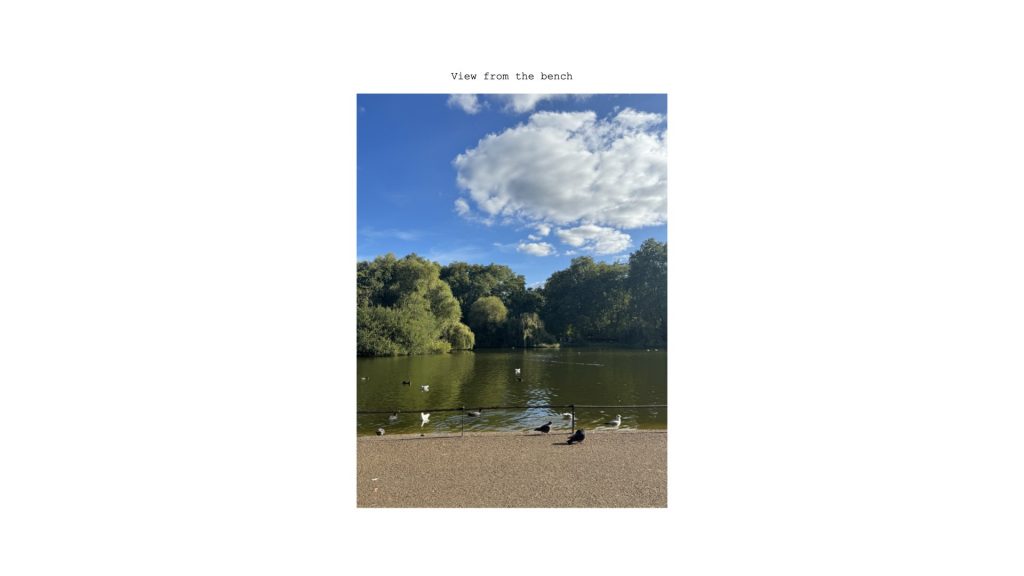
What I believe makes St. James’s Park unique compared to other parks in central London, is the diverse range of bird species living inside it.
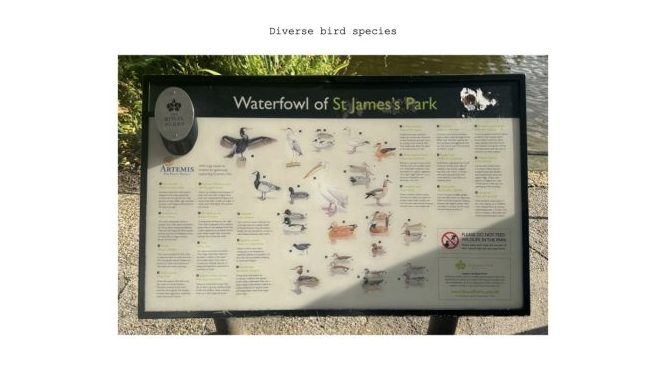
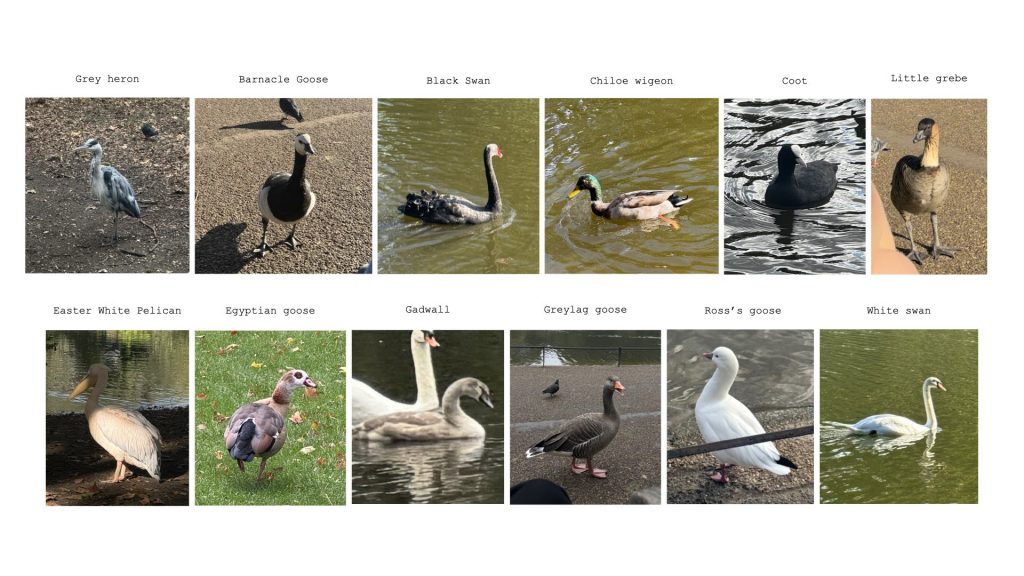
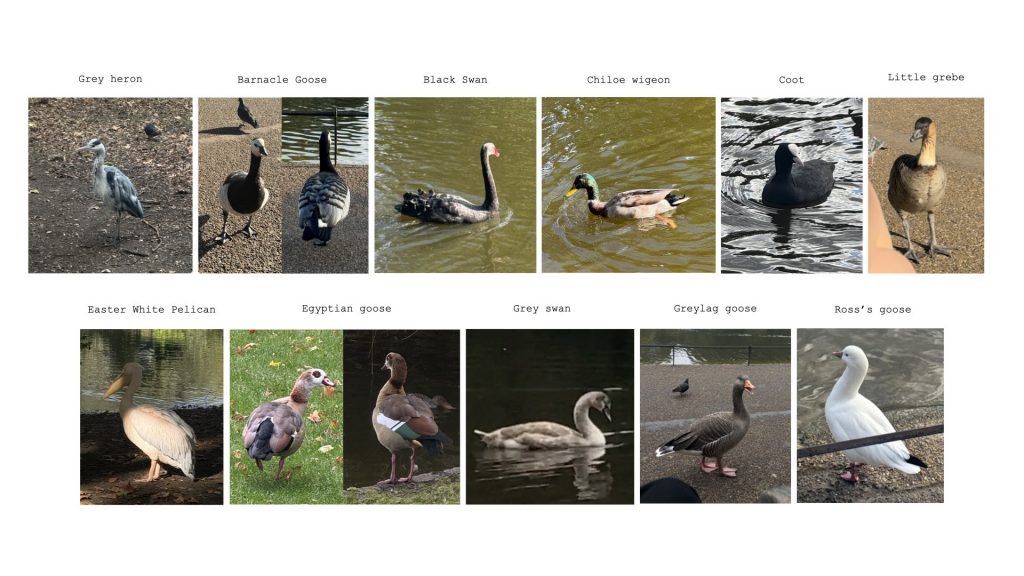
I was able to easily spot different types of birds introduced in signages located along the lake!
While observing the site from the bench, I noticed the different bird species interacting with each other inside the lake and they constantly move in different directions which creates random patterns.
I thought this could be an interesting point to further investigate so I took a few videos of the site.
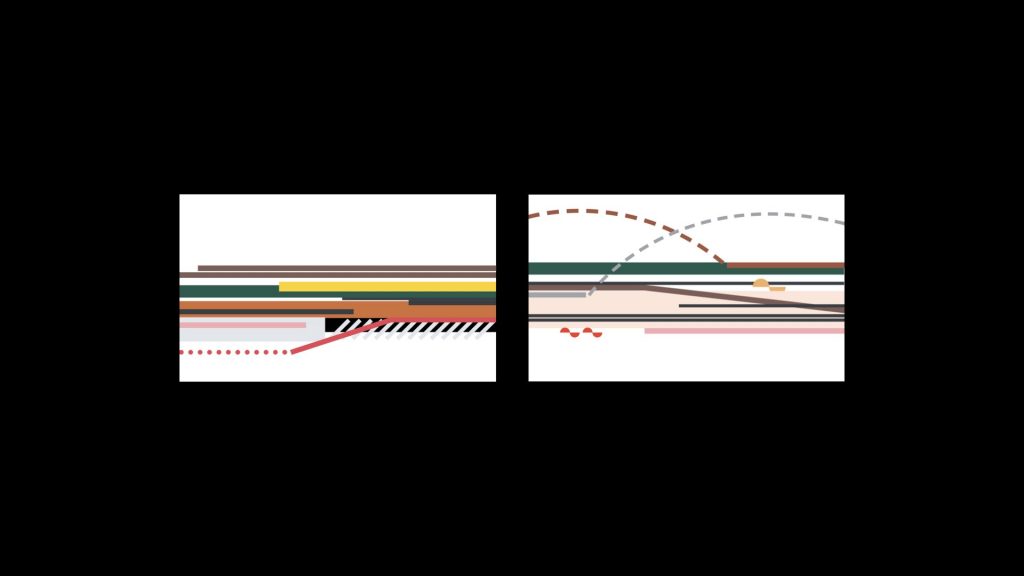
Then I color-coded each type of birds
and created a graphical representation of the movement of the birds following their path inside the site.
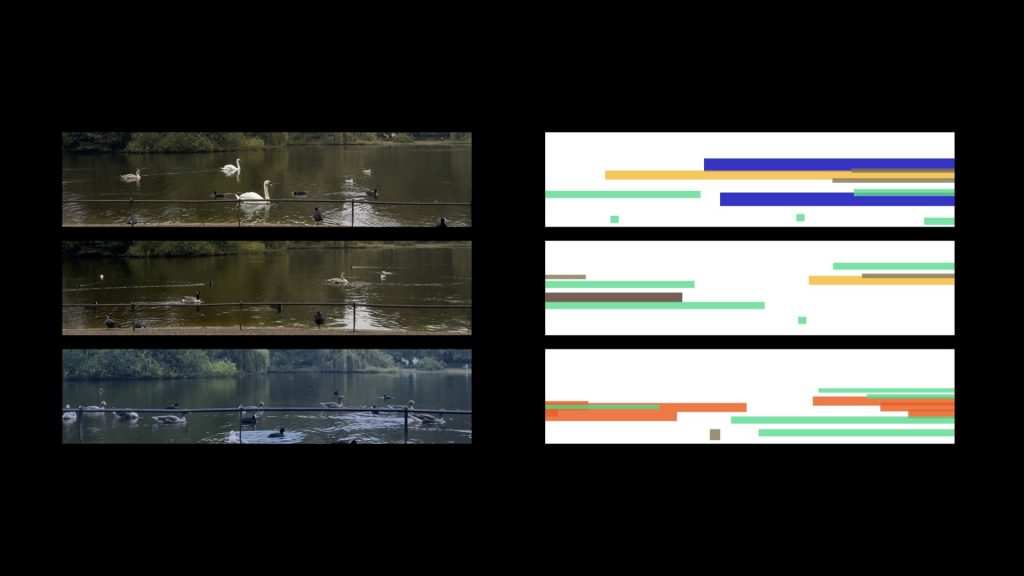
I also thought the movement of the birds somehow resembles Morse code, so this is what I might investigate more next week.
Feedback
- The visual outcome looks like the video Flume by Jonathan Lavada, who creates infographics of bird movements with music
- The graphics could turn out more interesting if I record the place for a longer period (maybe a day?) and the lines will create a more complex visuals >> suggested to borrow a GoPro from the loan store
- The current color-code is random >> give meaning to each colors (someone suggested maybe using the color of the birds’ eyes)
- Also looks at how specific birds interact with each other
- consider different motions, such as when the bird is pausing
Week 3
A few more photographs of the site and the bench I was seating on.
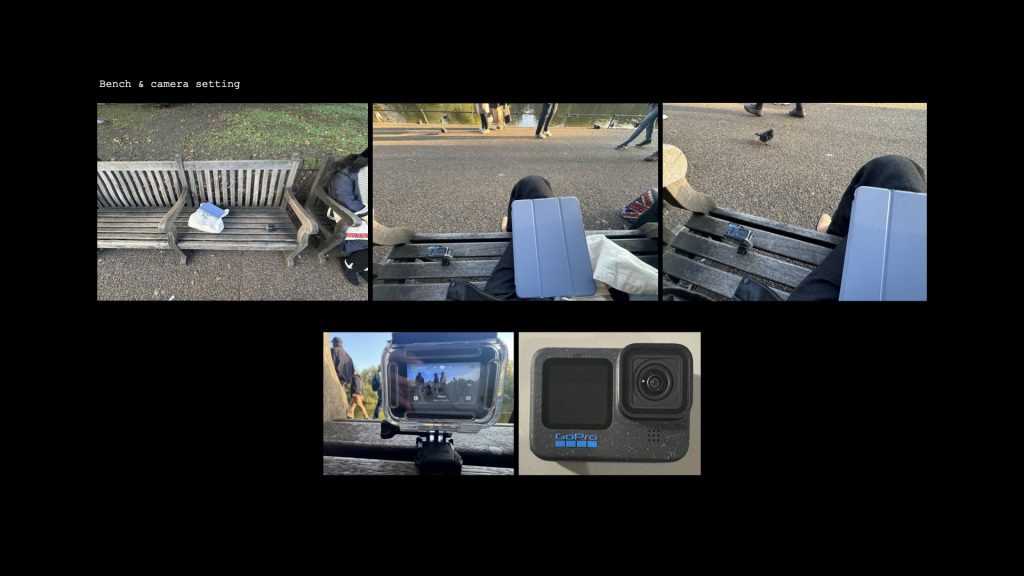
I borrowed a GoPro from school to record the site. The size was very compact and the shape was stable so it was easier to record the video for a long period.
NEW!
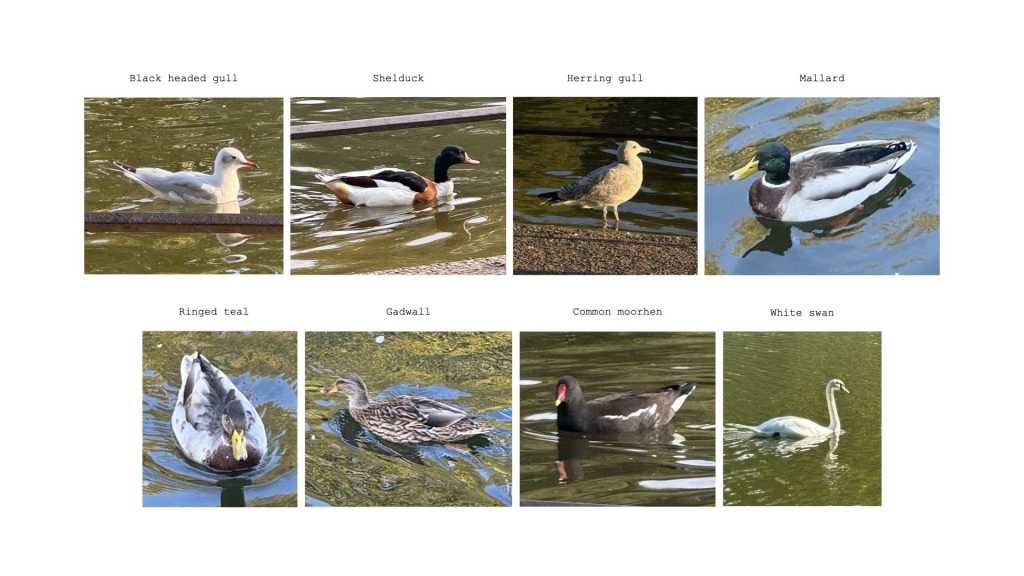
From last week’s collection of bird images, I was able to spot and capture a few more new species!
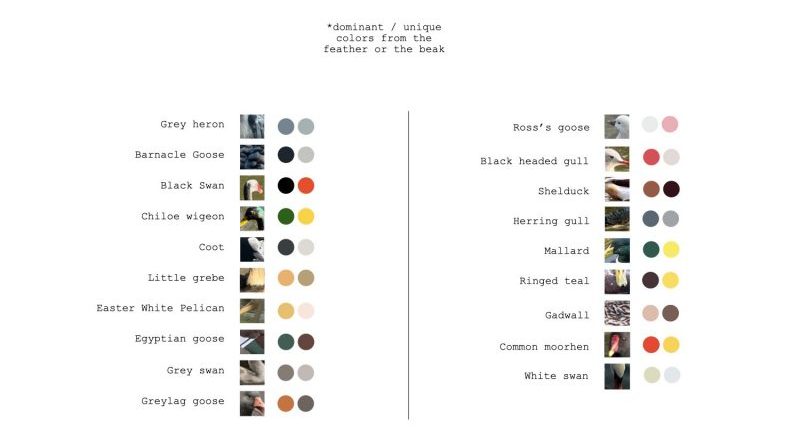
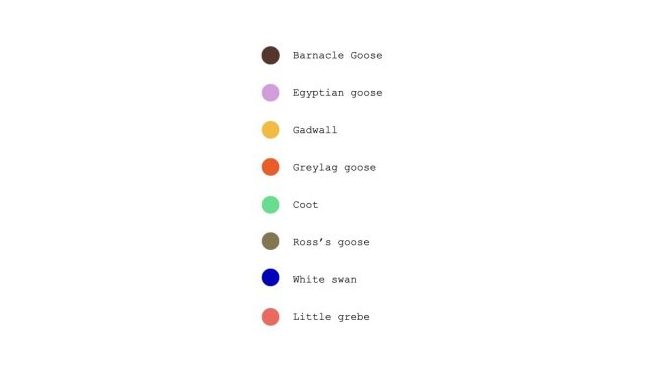
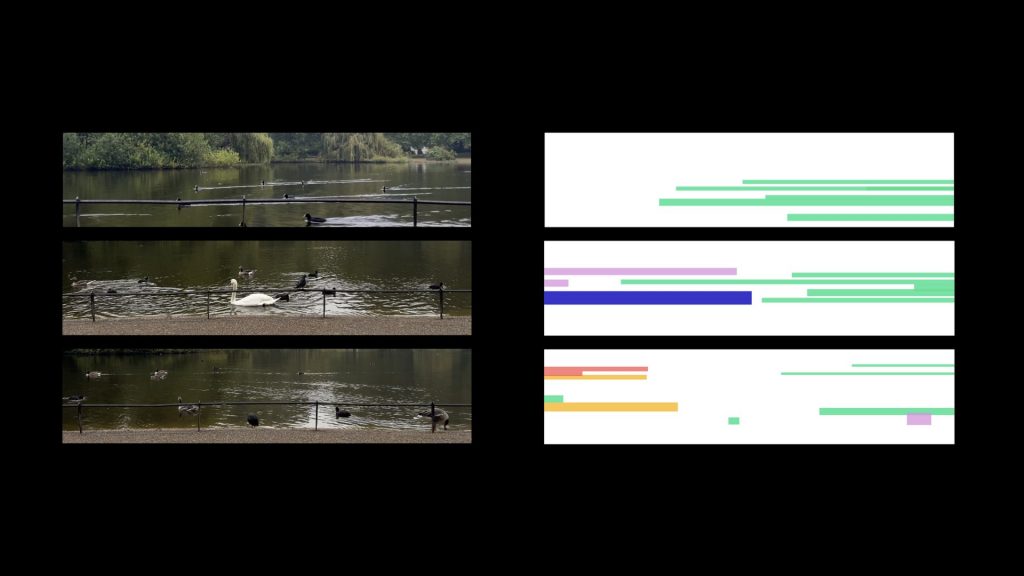
The color-code I made last week did not have any context and it was assigned randomly. So to fix this, I chose 2 dominant or unique colors from each bird species, either from their feather or the beak.
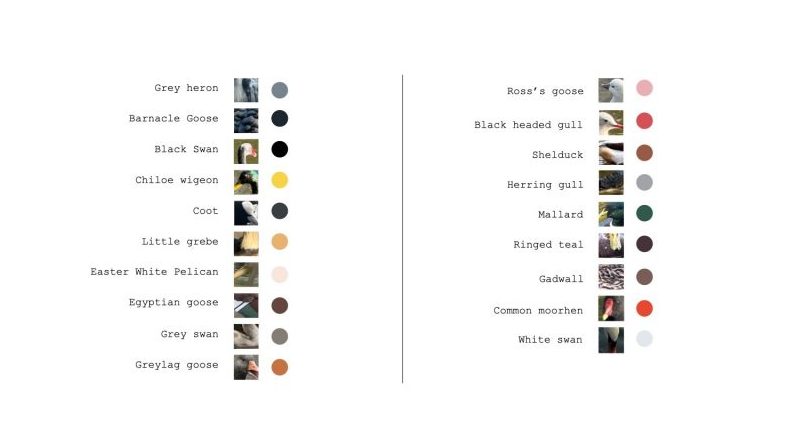
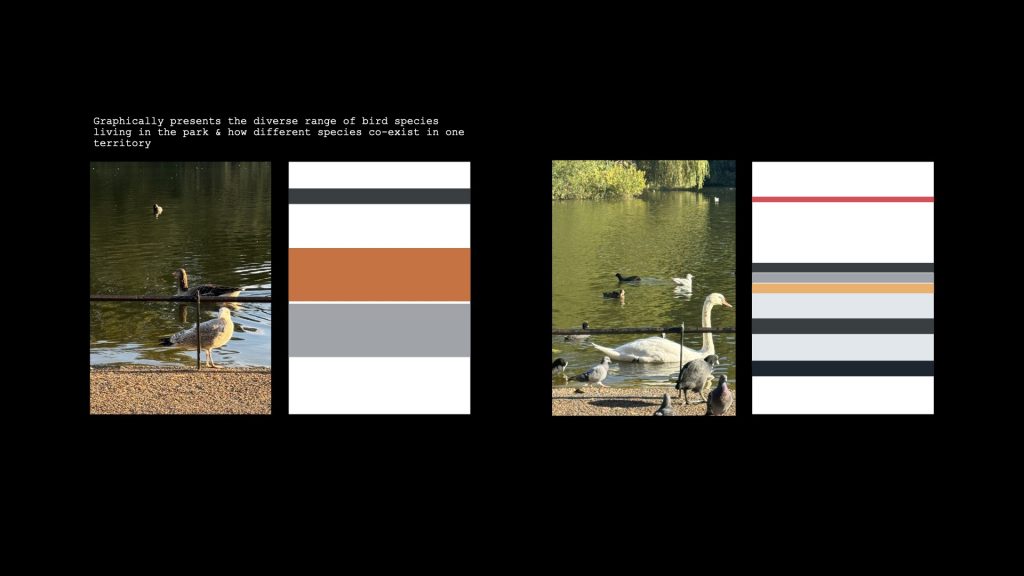
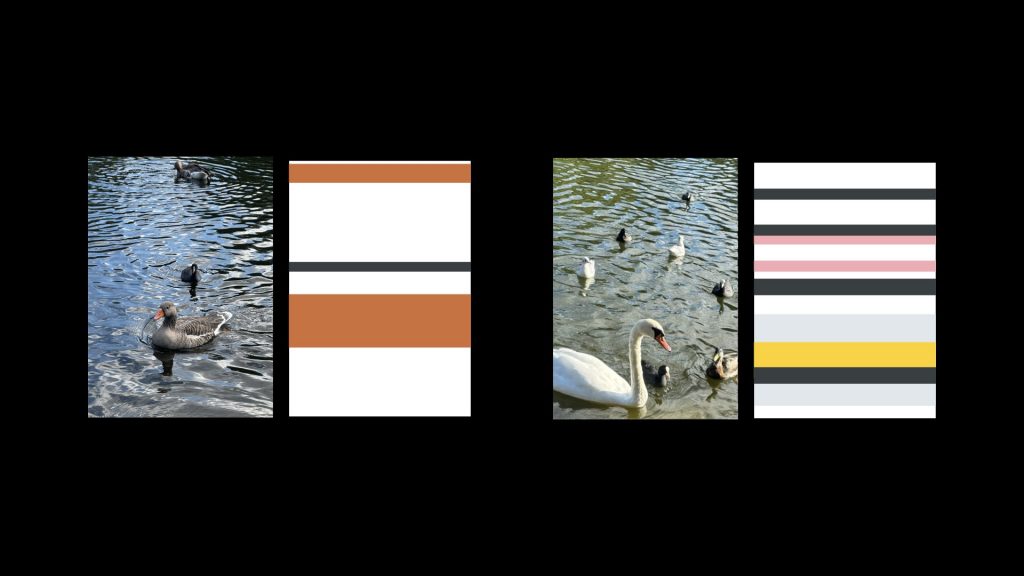
Above is the final color code and using this I tried to graphically present the diverse range of bird species living in the park and depict how they co-exist in one territory.
Using the new color-code system and new video recording, I created a newer version of motion graphics that visualize the movement of the birds in the lake. Another feature I added is the representation of the pausing motion of the birds. This was shown by the line gradually increasing the weight until the bird started to move again.
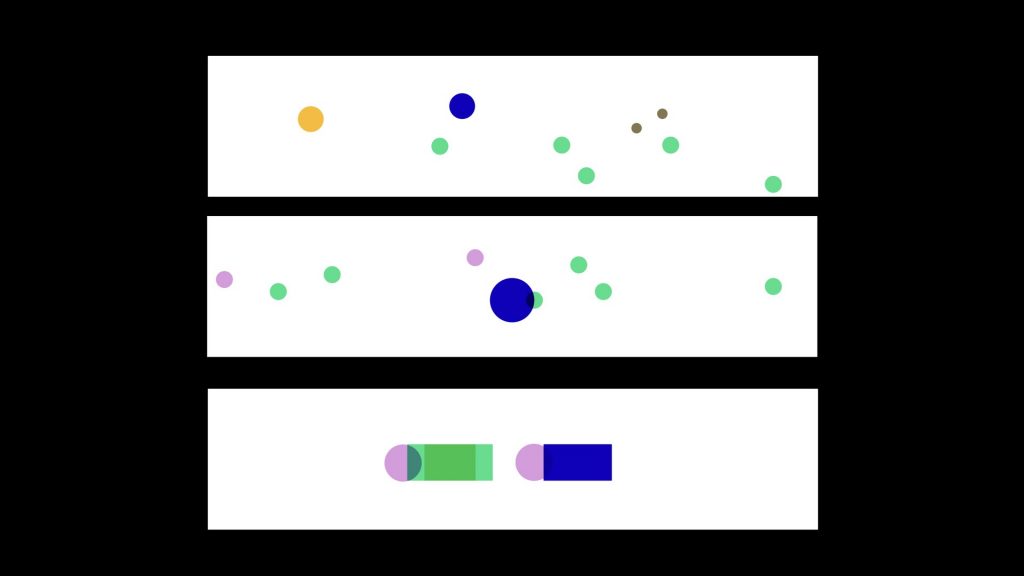
While working on the motion graphics, I realized birds have more types of motions than just swimming and pausing. Below is a simple video I created to represent the different types of their motions, which are: diving, landing, chasing, and walking.
By using this classification, I will be able to create more unique and random graphics. Below are examples of how the outcomes could turn out.